
This simple function will save you hours
EXCEL HACKS

Image by Anne-Virginie Le Bihan from Pixabay
Have you ever needed to extract a unique list of items from a dataset and immediately turned to a pivot table?
There’s a faster, simpler way that can save you hours:
The UNIQUE function.
Syntax
=UNIQUE(array, [by_col], [exactly_once])
array is the data set or range that you are selecting
[by_col] This is an optional argument that indicates whether to compare data by rows or columns. If omitted, it defaults to comparing by rows.
[exactly_once] This is an optional argument that specifies whether to return only values that appear exactly once in the array. If omitted, it defaults to returning all unique values, regardless of how many times they appear.
How to use the UNIQUE function
Watch Video
Step by Step Instructions
Example
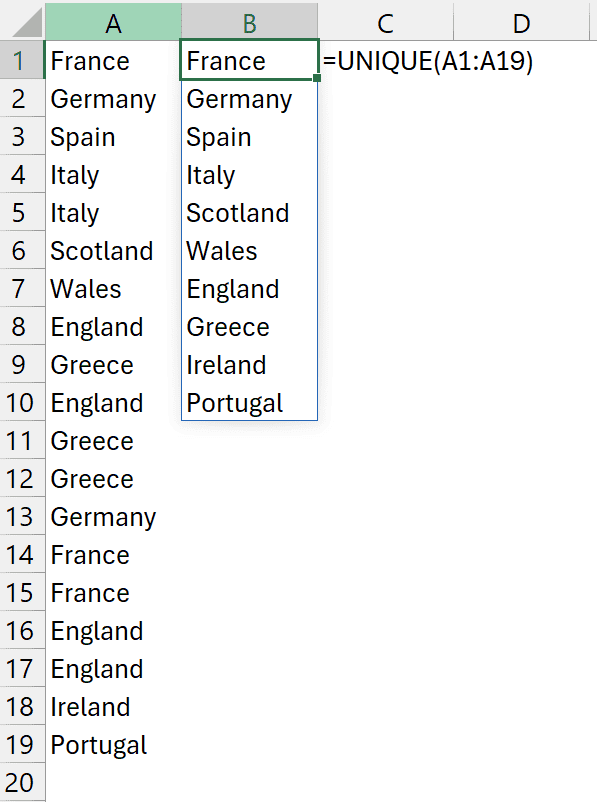
In the below example, column A is the dataset which lists European countries. In column B, the UNIQUE function has been used to extract each unique country
Formula =UNIQUE(A1:A19)
Note the blue line around the extracted list of unique countries. This represents a spilled array
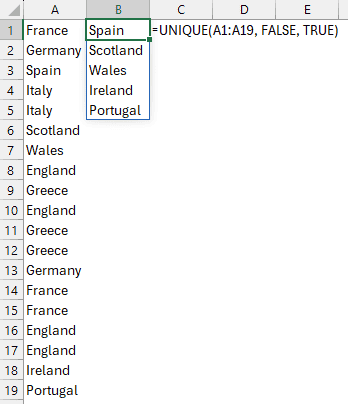
The UNIQUE function can also identify a distinct list i.e. the item(s) that only appear once.
In the below example, the UNIQUE function is applied to the data set in column A. The by_col argument is set to FALSE to compare the data by rows, and the exactly_once argument is set to TRUE to return only those countries that appear once in the list.
A game changer right? But lets not stop there.
You can also pair the UNIQUE function with the SORT and COUNTA function.
Using SORT and COUNTA functions with the UNIQUE function
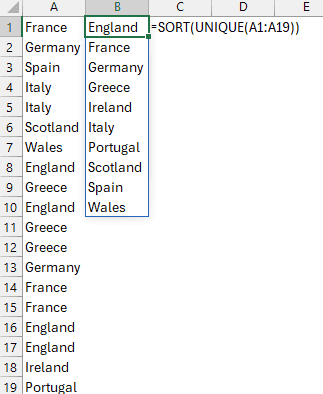
SORT allows you to sort the extracted data from A to Z. To do this, wrap the UNIQUE function in SORT
Formula =SORT(UNIQUE(A1:A19))
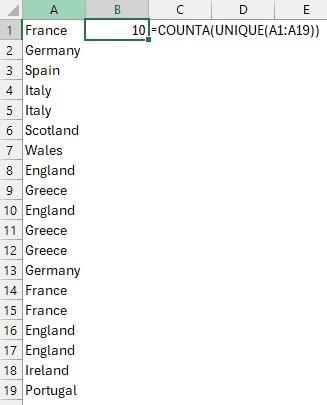
COUNTA allows you to count how many unique items there are. In the below example, we want to see how many unique countries there are
Spoiler alert: there are 10 unique countries
Formula =COUNTA(UNIQUE(A1:A19))
And there you have it. The UNIQUE function.
Stay ahead with the latest in data visualisation — insights, tools, and trends delivered straight to your inbox.