
the CHARTS gallery
Charts That Tell the Story
Numbers made simple. Visuals ready to publish.
Contact us to license or commission a visual.

MARKET JANUARY 2026
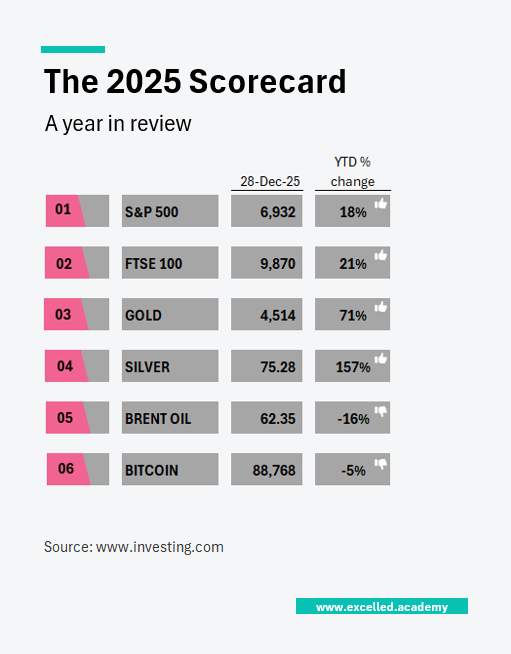
MARKET DECEMBER 2025

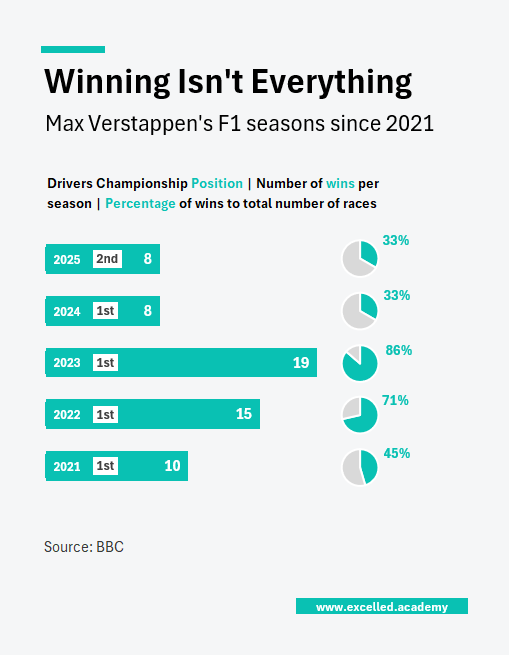
SPORT DECEMBER 2025
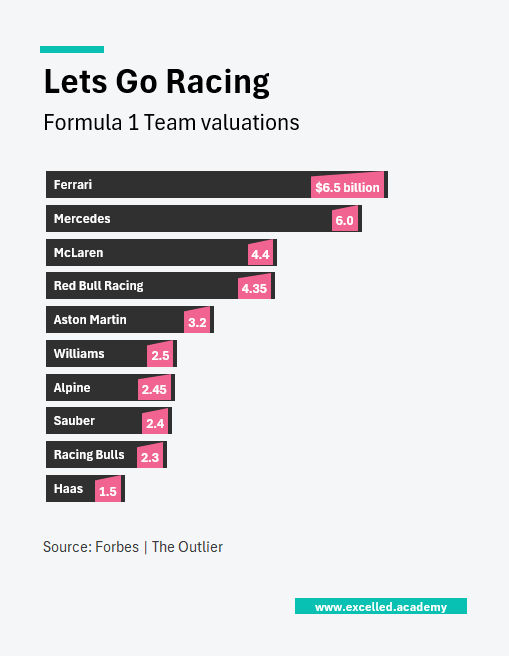
SPORT DECEMBER 2025
SPORT DECEMBER 2025
BUSINESS NOVEMBER 2025
BUSINESS NOVEMBER 2025
BUSINESS NOVEMBER 2025
BUSINESS OCTOBER 2025
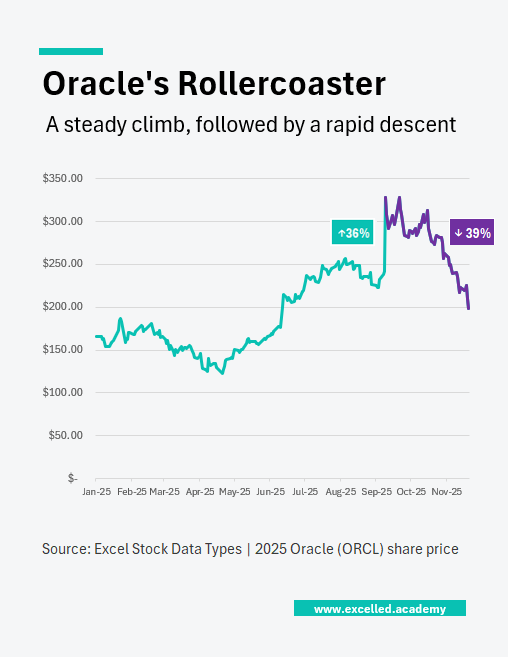
MARKET OCTOBER 2025
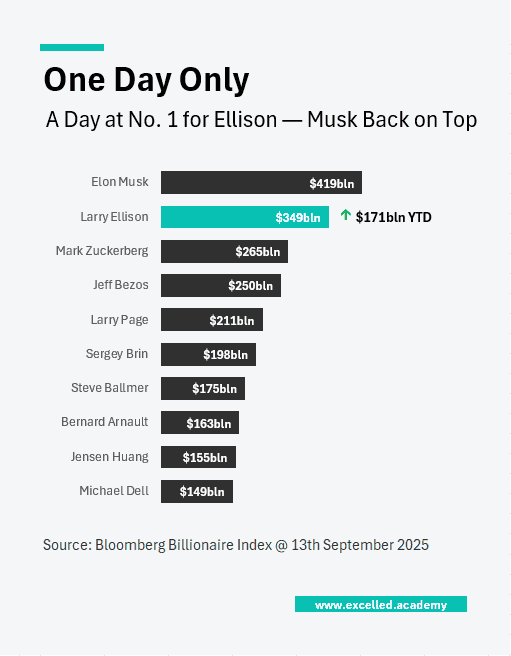
BUSINESS SEPTEMBER 2025
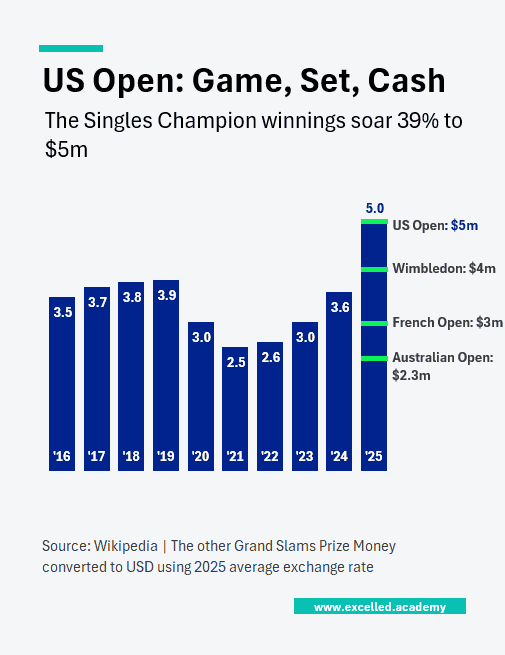
SPORT SEPTEMBER 2025
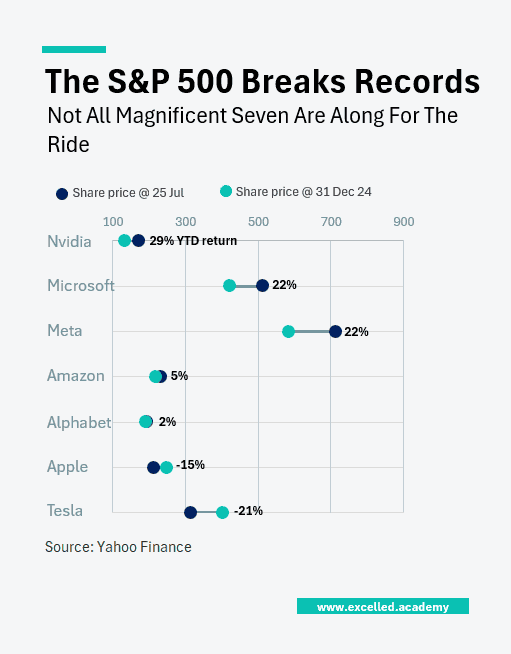
BUSINESS JULY 2025
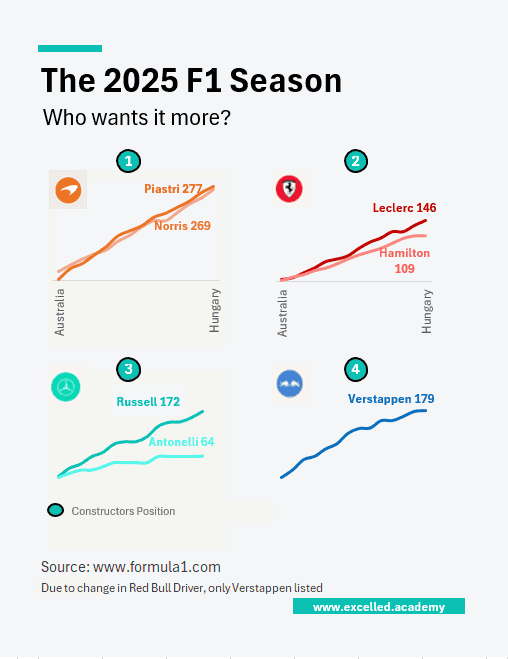
SPORT JULY 2025